Many of these functions were written for and included in the MVPA toolbox.
Other useful resources:
If you have two structs with identical fields, and you'd like to end up with one struct, where each of its fields is the concatenation of the original two fields, e.g.
s1.blah = [1 2 3];
s1.blah2 = [10 20 30];

s2.blah = [4 5 6 7 8];
s2.blah2 = [40 50 60 70 80];

s1and2 = grow_struct(s1,s2);

s1and2 =

     blah: [1 2 3 4 5 6 7 8]
    blah2: [10 20 30 40 50 60 70 80]
This is what grow_struct.m. is for. It's not too hard a problem, but I wanted to do a lot of error-checking to make sure that the two structs contained all and only the same fields, and that the lengths of all the fields in each struct are the same. And there's a unit test for it too.
[with David Weiss]
Sometimes it makes more sense for an argument to be a function handle, and sometimes just a string. It's easy to convert from one to the other with str2func.m and func2str.m, but it's a pain to have to check every time. Arg2funct.m takes in either, and gives you back both.
>> [funct_hand funct_name] = arg2funct('max')

funct_hand =

    @max

funct_name =

max

>> [funct_hand funct_name] = arg2funct(@max)

funct_hand =

    @max


funct_name =

max
[With Chris Moore and David Weiss]
Propval.m is a powerful and flexible way of dealing with optional arguments that makes it easy for the user to feed in optional arguments, and easy for the developer to parse them, or to pass them onto inner functions that also take optional arguments.
An example will make this clear. Let's imagine that your function, myfunct.m, takes in one required argument (REQ) and a series of optional arguments.
function [out] = myfunct(req, varargin)

REQ = required argument.

OPT1 (optional, default = 100).

OPT2 (optional, default = 'default').
Propval.m makes it easy for the user to call that function in any of the following ways:
out = myfunct(req);

out = myfunct(req, 'opt1', 200);

out = myfunct(req, 'opt2','override', 'opt1',200);

args.opt1 = 200;
args.opt2 = 'override';
out = myfunct(req, args);
The first two examples utilize the same property/value pairs that many of Matlab's plotting functions and other toolboxes use, e.g.
plot([1 2 3 4 5], 'LineWidth', 5)
Just as they do, you can feed in zero or more of the optional arguments, those arguments have defaults, and you can feed them in any order.
The third example (as with the Optimization toolbox) allows you to bundle up all your arguments into a struct, and then just feed that in. Any fields in the struct that you feed in override the defaults.
From the point of view of the developer, the code for dealing with the optional arguments is as simple as we could make it:
% in myfunct.m

% define the defaults, as per the myfunct.m documentation above
defaults.opt1 = 100;
defaults.opt2 = 'default';
args = propval(defaults,varargin);

% then, to access them
args.opt1
args.opt2
Ok - if you've read this far, then hopefully you can already see the utility of this. The final scenario that propval.m can help with is when you have multiple functions that take optional arguments, and you want the user to be able to call the outermost and have their arguments passed on to the inner functions.
Let's imagine that myfunct.m calls anotherfunct.m, which also takes in optional arguments. From the user's point of view, we can just call myfunct.m with an 'opt3' argument:
out = myfunct(req, 'opt1',200, 'opt3','10000);
This will override opt1's default in myfunct.m, but keep the default for opt2. We then want opt3 to be passed into anotherfunct.m, so we have to modify myfunct.m slightly:
% updated version of myfunct.m

defaults.opt1 = 100;
defaults.opt2 = 'default';
[args unused] = propval(defaults,varargin);

anotherfunct(unused)
N.B. the latest release of Matlab has a new inputParser object that performs a similar purpose. It allows you to define all kinds of crazy validation functions, and designate arguments as optional and required, but I don't think it allows you to feed in your arguments as a struct rather than as property/value pairs.
The 'keyboard' command is very useful. Just plop it in the midst of your m-file, and it will pause right there, allowing you to inspect the state of the variables in that function's workspace.
Better still, you can modify these variables, then 'dbcont' to continue operation where you left off.
See also:
Add 'dbstop if error' to your startup.m. Then, if there's any kind of error, it'll be as though you'd typed 'keyboard' just before the error happened.
See also:
Matlab has a function for computing the standard deviation, but not the standard error - see ste.m.
You'd think that zscoring is as simple as (vec-mean(vec))/std(vec), but if you want to deal with matrices (doing the right thing with singleton dimensions), zscore along different dimensions etc. and avoid for loops, then you need to be a little more careful.
If you have the Statistics toolbox, it includes a wonderfully compact zscore.m - otherwise, zscore_mvpa.m is a reasonable standin.
[Courtesy of Vaidehi Natu]
The Matlab Fourier functions are pretty fancy, but if you're not a signal processing engineer and you just want a sense of which frequencies are present in a timecourse, fft_simple.m might help get the hang of things.
A median filter is a basic but often useful way of smoothing your data. For each point, replace it with the median of itself, and the two points either side. Using the median rather than the mean is a good idea when your data contains outliers you'd like to remove, because it will simply replace them with one of their neighbours.
If you want to set the position and size of a figure on the screen, you need to know how big your screen is, so that you can set the figure's coordinates relative to it:
curfig = figure();
screensize = get(0,'screensize');
width = screensize(3);
height = screensize(4);
horsize = 800;
vertsize = 600;
figpos = [screensize(3)-horsize screensize(4)-vertsize horsize vertsize];
set(curfig,'Position',figpos);
[From Sean Polyn]
I got fed up with the tendency for calls to the "figure" command in matlab stealing focus from all other applications (such as when you are running a big loop making lots of figures).
So I googled: "matlab foreground figure" and the first hit pointed at sfigure.m (really just a single "set" command embedded in a little script) for SILENT FIGURES. So I'm happy.
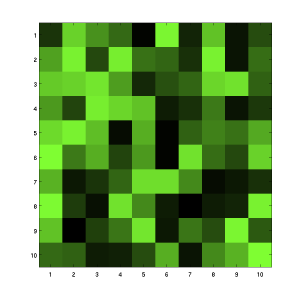
Bioinformatics people often use a colormap that ranges from green (high) to black (low). Greenblack.m creates just such a colormap (just like jet or bone, that you can use for plotting, e.g.
imagesc(rand(10))
colormap(greenblack);
Matlab's default is to try and format figure titles as though they're in latex, so underscores show up as superscript etc. Titlef.m is just a shortcut that sets the Interpreter to normal (and utilizes the same trick as dispf.m - see elsewhere on this page), e.g.
figure titlef('Now the under_scores don't show up as subscripts')
Matlab's print.m writes a figure out to an image file, but it's a little cumbersome to use. Printfig.m is a thin wrapper that assumes that you want to write a .png and defaults to a more usable paper size and margin options. If you combine it with datetime.m, capturing figures as you go along (e.g. for a scientific journal) is made easy.
figure
printfig(datetime)
When writing log files, it's often useful to append the date and time to the end of the filename. Irritatingly, if you use standard US mmddyy (or even the UK's ddmmyy) format, the natural ascii ordering of your logfiles will be very unhelpful. Sorting by date created is sometimes the solution, but writing out the date in yymmdd avoids the problem altogether.
Datetime.m just warps a call to datestr, optionally appending seconds.
>> datetime

ans =

070921_0058

>> datetime(true)

ans =

070921_0058_40
P.S. This is also handy if you're a Brit abroad, who finds it really confusing to remember whether days or months are written first in your current domicile. This way, you just have to remember that it's in order of priority, which makes much more sense.
[based on http://www.mathworks.com/matlabcentral/files/4570/startup.m]
I often want to be able to rewind to a previous matlab session, to remind myself of how I did something, or what commands I ran. It's pretty easy to get matlab to log your current session with the 'diary' command, but I would never remember to run that at the beginning of each session. By putting these lines into your startup.m, matlab will automatically create a diary file for every session you ever have, and organize them neatly by date in a directory of your choosing.
pathfn = datetime();
pathfn=[ '~/diaries/diaries_' pathfn '.out'];
cmd=['diary ' pathfn];
eval(cmd);
diary on
Just change the '~/diaries/' to a directory of your choosing.
N.B. This requires the 'datetime.m' function - see elsewhere on this page.
If you want to know the index of the maximum value in one vector/matrix, and then apply that index to get a value from another vector/matrix, then you'd usually need to call max.m, get the index, and then use it. To do that in one line as God intended:
% get the index of the max from v1, and then
% use that index to get a value from v2
v2(maxi(v1))
The most elegant way to do this I could think of was simply to reverse the order that max.m returns its arguments.
function [idx vals] = maxi(mat)
See maxi.m, mini.m and sorti.m.
Very simple but handy - compare_size.m.
>> compare_size(rand(5), rand(6))

ans =

     0

>> compare_size(rand(5), rand(5))

ans =

     1

>> compare_size(rand([10 10 1]), rand([10 10]))

ans =

     1

>> compare_size(rand([1 10 10]), rand([10 10]))

ans =

     0
See count.m - just a shortcut for length(find(x)).
>> vec = [10 20 30 40 50 60];
>> count(vec>35)

ans =

     3
I often want to be able to type things like:
disp('2 + 2 = %i', 2+2)
But for some reason, disp.m won't allow sprintf-like arguments, so dispf.m rectifies this.
>> dispf('2 + 2 = %i', 2+2)
2 + 2 = 4
If you have a big for loop that takes a long time, it's reassuring and useful to get a progress update every n% of the way through. Progress.m makes that easy, and prints your progress in a friendly way, e.g.
nSteps = 500;
for n=1:nSteps
  progress(n,nSteps);
  % do something
end % v
        ...  10%  20%  30%  40%  50%  60%  70%  80%  90%  100%  done
Matlab's isinteger.m only tells you the type of the values in a matrix. This may not be what you want. For instance:
>> a = [1 2 3 4 5]

a =

     1     2     3     4     5

>> isinteger(a)

ans =

     0
Ziad Saad's afni_matlab library contains a handy isint.m:
>> a

a =

     1     2     3     4     5

>> isint(a)

ans =

     1
Matlab's vec2ind.m is useful if you have a matrix of zeros where each column has a single 1. You want the indices of those columns.
Unfortunately, it completely ignores columns that are all-zeros. Vec2ind_inclrest.m will include those in the output, marking them with zeros. You can see the difference here (note how they differ with regard to the 5th column of zeros):
>> a = [1 0 0 0 0 1; 0 1 0 1 0 0; 0 0 1 0 0 0]

a =

     1     0     0     0     0     1
     0     1     0     1     0     0
     0     0     1     0     0     0

>> b = vec2ind(a)

b =

     1     2     3     2     1

>> b = vec2ind_inclrest(a)

b =

     1     2     3     2     0     1
Likewise, ind2vec.m will burp if you try and reverse the process, so ind2vec_robust.m to the rescue.
>> ind2vec(b)
??? Error using ==> sparse
Index into matrix must be positive.

>> ind2vec_robust(b)

ans =

     1     0     0     0     0     1
     0     1     0     1     0     0
     0     0     1     0     0     0
Home - Blog - Startups - Software - Research - Writing
Email me - updated 31 Dec 2012